Panorama: How to identify root cause after “ORA-1652: unable to extend temp segment”

If you find this message “ORA-1652: unable to extend temp segment” in alert.log there are two alternatives for reason:

  1. The session causing the ORA-1652 has allocated large memory in temporary tablespace itself and got ORA-1652 at the end of available space
  2. Other sessions did successfully allocate large amount of memory in temp tablespace but this session with only small demand got ORA-1652

But how to identify the session that really claimed large amounts in temporary tablespace and therefore is responsible for the ORA-1652?

With Panorama you can clarify this as follows:

  • Go to menu “Schema / Storage” / “Temp usage” / “Historic”.
  • Choose the concerning period and appropriate time unit.
  • Sort table by column “Max. TEMP allocated”
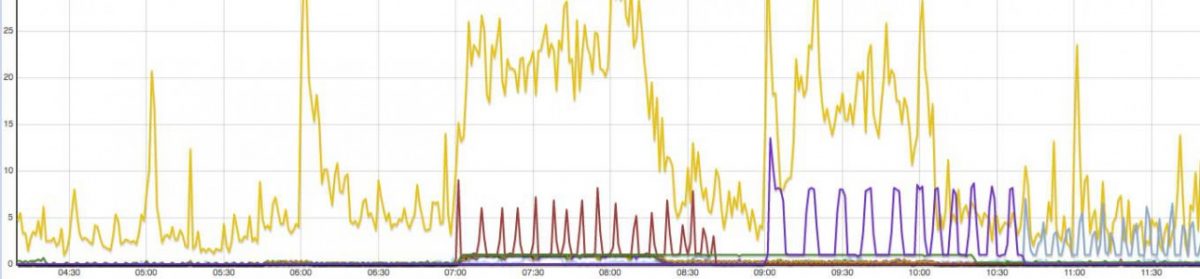
  • Show column “Max. TEMP allocated” in diagram via context menu click in column and select “Show column in diagram”

Temp_Usage_1

Now let’s check the temp usage peak at 00:10.
One of several ways to identify the sessions causing the peak is:

  • Click the value in column “Total time waited” for the first row (at 00:10:00).
    This opens the evaluation of active session history grouped by RAC-instance for the minute from 00:10:00 until 00:11.00.
  • Click the value in column “Session / Sn.” for the instance with highest value in column “Max. temp”
  • You get a table with onle row per “Session / Sn.” now
  • Remove the filter on instance at next page if multiple instances claimed significant temp space.
  • Sort the table descending by “Max. temp”
  • Finished: Now you see the sessions claiming temp space at this time
  • Within this table you can view further details for that sessions like execution context, SQL statements they executed, wait events, affected DB-objects and much more.
  • If you use parallel query, click in column “Parallel query” to see temp usage of parallel query slaves also for this coordinator, because “Max. temp” only shows the maximum temp usage over coordinator and his slaves

Temp_Usage_2

Panorama: User is enabled to add personal SQL to dragnet list

In menu ‘Spec. additions’ / ‘Dragnet investigation’ now you have the opportunity to add your own personal SQL-statements to the predefined list of dragnet SQLs.

This SQLs are stored at Panorama’s server instance and are available for your personal browser instance only.

Choose ‘Add personal selection’ from menu ‘≡’ and customize the JSON template for your purpose.
You will get a new menu ‘Personal extensions’ in your list of SQLs then.

Personal_dragnet_SQL


If you want to persist this SQLs and provide them to all users of your Panorama instance, you can store them as JSON-array in a file ‘predefined_dragnet_selections.json’ stored at PANORAMA_VAR_HOME.

Panorama: Fix changed execution plans

You recognize a long running query caused by poor execution plan.

You also know that until yesterday this query worked fine but now execution plan has suddenly changed due to ???.

Filipe Martins named a solution here by transferring a good execution plan from AWR history into a SQL plan baseline.

This solution is available in Panorama now.
It allows you to quickly generate a SQL snippet for creation of  SQL plan baseline by simple button click.

Steps to fix this issue:

  1. Identify the problematic query, open SQL details page in Panorama for this statement.
    For example via menu “SGA/PGA details” / “SQL Area” / “Current”
  2. Hit button “Complete time line of SQL” at the bottom of the SQL details page
  3. Identify a day (or hour/minute) in history in the list with exactly one good execution plan.
    Column “Elapsed/Execution” may help you to rate the quality.
    Column “Plan hash value” allows you to differentiate different plans.
  4. Click the link in column “Start time” to open SQL detail page for this period
  5. Hit button “Generate SQL plan baseline” at the bottom of the SQL details page
  6. Execute the generated SQL snippet as appropriate user, e.g. SYS as SYSDBA

Now next execution of this statement will use the execution plan pinned by SQL plan baseline.

SQL details page will show you now the existence and some parameters of SQL plan baseline.

Remember please, that this joyful solution may be only temporary because if you modify the SQL statement next time it will lose the link to baseline.
So a better permanent solution would be to fix the execution plan by appropriate analyze-info, using optimizer hints in SQL etc. .