Caching SQL result sets or PL/SQL function results is very easy by done simply adding hint or flag “RESULT_CACHE”.
Without monitoring the usage of result cache this may lead to overbooking the size of result cache.
In excessive manner flooding the result cache with new entries may result in significant latch waits.
This latch waits will influence other concurrent sessions and occur also for sessions using only few result cache entries.
You should pay attention to size result cache according to your needs and avoid massive crowding out.
So using only 80% to 90% of result cache is a good rule of thumb to avoid the risk of latch waits on result cache.
Example problem:
Consider the following PL/SQL-Function that computes something possibly time dependent:
FUNCTION getCachedValue
  p_Parameter1 IN NUMBER,
  p_Parameter2 IN NUMBER DEFAULT NULL,
  p_Date IN DATE DEFAULT SYSDATE
) RETURN VARCHAR2 PARALLEL_ENABLE RESULT_CACHE;
With usage in PL/SQL code but ignoring the time dependency parameter:
FOR x IN 1..10000 LOOP
  ...
  curr_val = getCachedValue(24);
END LOOP;
What happens is:
Every second you will have a new function call signature due to parameter “p_Date” with default value “SYSDATE” and therefore you store lots of new entries in result cache.
How to monitor result cache usage:
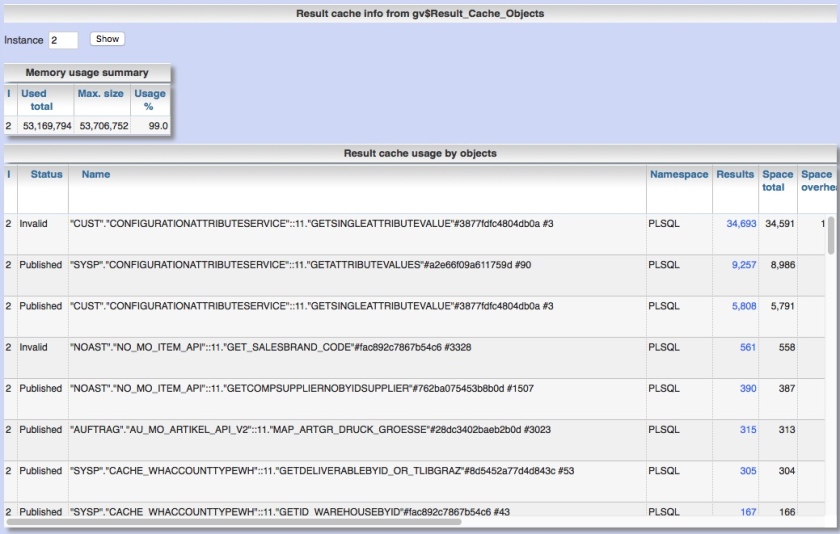
You can evaluate result cache usage by querying gv$Result_Cache_Objects.
With Panorama you can monitor result cache usage at menu “SGA/PGA-details” / “Result Cache” / “Current”:
You will see the max. size and % usage of result cache and also the detailed objects currently stored in result cache.
How to trace back latch waits to source:
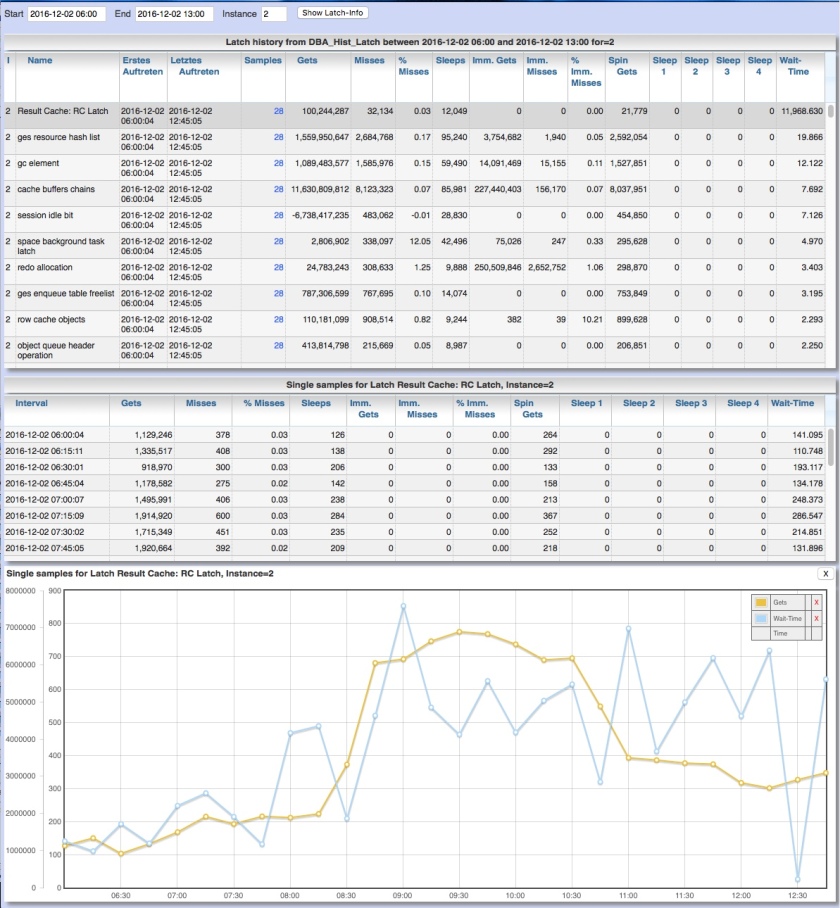
Evaluation based on table DBA_Hist_Latch can be done with Panorama at menu “Analyses / statistics” / “Latch statistics” / “Historic”.
For this example screenshot you see by column “Wait time” that latch waits at result cache are the top reason for latch waits.
You can drill down deeper into single AWR cycles and draw values as chart on timeline.